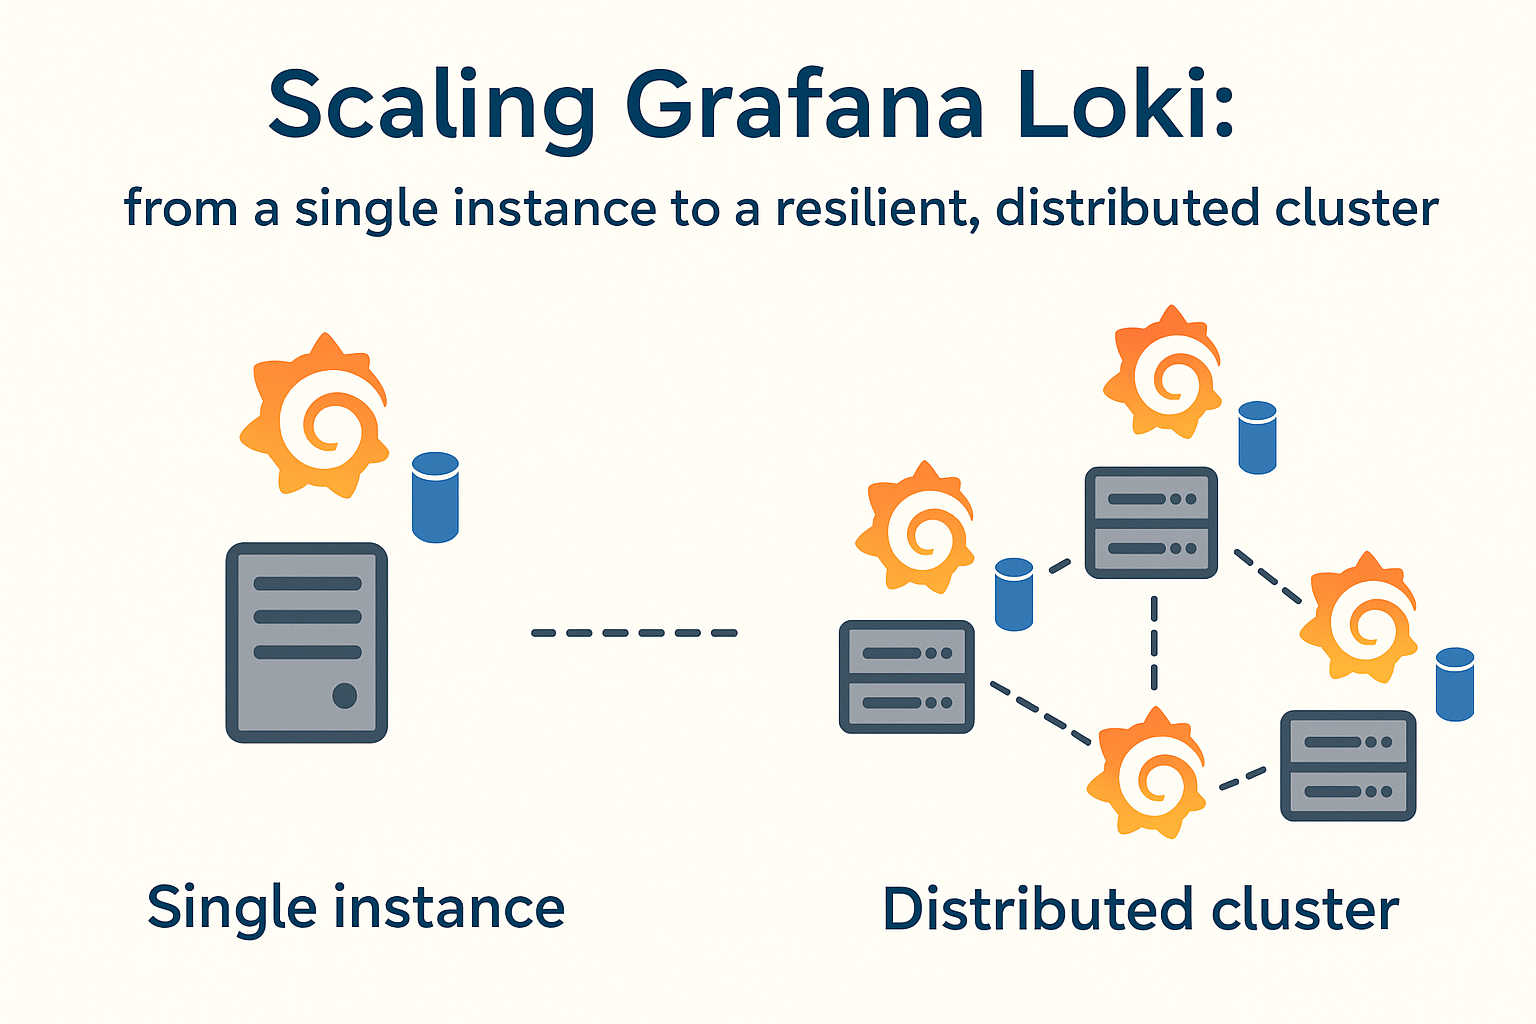
Distributed Loki architecture

This post is part of the Grafana-Ecosystem series.
Scaling Loki: From a Simple Monolith to a Distributed System⌗
In the world of observability, every tool starts with a promise of simplicity. Grafana Loki is a perfect example. It’s a logging system designed to be lean, cost-effective, and easy to run. For anyone starting out, deploying it as a single, monolithic instance is the obvious first step. It handles ingestion, storage, and querying in one neat package.
But systems evolve. Log volumes grow, teams expand, and the demands on our tools intensify. That initial simplicity, once a strength, can become a liability. The monolithic architecture, which was once so practical, begins to reveal its limitations.
This post is about that journey , the architectural shift from a single Loki instance to a distributed system. It’s not just a technical guide; it’s a look at the principles that drive the need for scale and resilience in a modern observability stack.
The Monolithic Trap: When Simplicity Stops Scaling⌗
A monolithic Loki instance is a powerful tool. It’s the Swiss Army knife of logging. But like any all-in-one tool, it faces challenges when put under specialized, heavy load. At its core, the problem comes down to one thing: resource contention.
A monolith performs three distinct jobs at once:
- Ingestion: Receiving and processing incoming logs.
- Storage: Indexing log metadata and writing data to an object store.
- Querying: Searching and retrieving logs for users.
When these functions run in the same process, they compete for the same CPU, memory, and network resources. A massive, long-running query from a single user can starve the ingestion process, delaying critical log data. A sudden burst of logs can impact query performance.
This leads to three fundamental problems:
- Performance Degradation: Reads and writes interfere with each other.
- A Single Point of Failure: If the instance fails, the entire logging pipeline fails.
- Inefficient Scaling: You can’t scale one function without scaling them all.
When reliability and performance become non-negotiable, it’s time to break down the monolith.
The Blueprint: A System of Specialized Services⌗
The solution is to move from a single tool to a system of cooperating services. Think of it like a professional kitchen: you don’t have one chef doing everything. You have line cooks, a head chef, and an expo, each with a specialized role.
My distributed architecture applies this principle to Loki, splitting it into dedicated components across three virtual machines (vm-01, vm-02, vm-03), all managed with Podman Compose:
- Write Nodes: These are dedicated solely to log ingestion. Their only job is to accept logs quickly and reliably.
- Read Nodes: These serve queries from Grafana. They are optimized for searching and retrieving data, without ever interfering with ingestion.
- Backend Node: This is the coordinator. It manages the cluster state, the index, and the compaction schedule, ensuring everything runs smoothly.
- NGINX Gateway: A reverse proxy that acts as a single, intelligent entry point for all traffic.
This design isn’t just about adding more servers; it’s about creating a system where each part can do its job without compromise.
graph LR
    subgraph "Clients"
        direction LR
        Apps[Applications]
        Grafana[Grafana]
    end

    subgraph "Entry Point"
        NGINX[NGINX Gateway]
    end

    subgraph "Loki Cluster Components"
        direction LR
        WriteNodes[Write Nodes]
        ReadNodes[Read Nodes]
        Backend[Backend]
    end

    subgraph "Storage"
        S3[(S3 Object Store)]
    end

    %% Data Flow
    Apps -- "Log Ingestion" --> NGINX
    Grafana -- "Log Queries" --> NGINX

    NGINX -- "Write Path" --> WriteNodes
    NGINX -- "Read Path" --> ReadNodes

    WriteNodes --> Backend
    ReadNodes --> Backend
    Backend --> S3

    %% Styling
    style Apps fill:#cde4ff
    style Grafana fill:#cde4ff
    style NGINX fill:#d5e8d4
    style S3 fill:#f8cecc
Core Principles of the Distributed Design⌗
1. Isolate Your Workloads⌗
The most important principle is the separation of reads and writes. In this model, a user running a month-long query on a read node has zero impact on the write nodes’ ability to ingest real-time logs. This isolation guarantees performance and reliability where it matters most.
2. Centralize Coordination⌗
The backend node is the source of truth. It manages the cluster’s “ring” (its map of all members) and the TSDB index. By giving this critical function its own dedicated service, the cluster remains stable and consistent, even under heavy load.
3. Unify Your Entry Point⌗
The NGINX gateway is more than just a reverse proxy; it’s a control plane.
- It Simplifies Everything: Grafana and all other clients connect to a single URL.
- It Provides Control: It’s the ideal place to implement authentication, rate limiting, and routing rules.
- It Adds Intelligence: It inspects incoming requests and routes them to the correct component,
/pushrequests go to write nodes, while queries go to read nodes.
When Should You Make the Switch?⌗
A distributed architecture is not for everyone. For smaller projects or development environments, a monolithic Loki is still the best choice, it’s simple and efficient.
However, it’s time to consider a distributed model when:
- Your query performance is becoming unpredictable.
- Log ingestion delays are no longer acceptable.
- You need to guarantee high availability for your logging pipeline.
- You want to scale your query and ingestion capabilities independently.
Moving to this architecture is a step toward building a truly production-grade observability platform. It requires a shift in mindset, from managing a tool to orchestrating a system, but the result is a logging infrastructure that is not only scalable but also fundamentally more resilient.
References:⌗
Other posts in this series
- Grafana Ecosystem
- Observability Pillars
- Distributed Loki architecture